

In chapter 11 of Data + Journalism, we explore ethics and transparency in data storytelling. One of the ways in which journalists can do this is to take their data diary — a live doc of steps they followed to produce the story and visualizations — and turn it into a Twitter thread.
Twitter threads are a series of tweets grouped together by a lead tweet — typically an overview with the link to the project — followed by a series of sub-tweets that provide details about the project.
Think of the subtweets as replies to the main post. They provide depth to the story and give your audience insight into how it was produced. You can mention reporting methods, issues you overcame, link to datasets and software you used, etc. Most threads are 10 to 20 tweets long.
It also gives readers a chance to reply and ask questions about the process, and, of course, retweet and share the posts.
Below is a series of Twitter threads used in data visualization and fact-checking projects by various media outlets. Click on “Read the Full Conversation on Twitter” or click on the headline to launch the full thread.
Jodi Cohen: ProPublica Illinois, UIC and FOIA Law
ProPublica: Migrant Children
Brought back an investigative piece on migrant children being separated from their parents after ICE began its detention areas in Texas in June. Shows depth and note how they broke down each tweet by person/issue. It really “put a face” on the story, rather than just sharing a bunch of statistics.
BBC Africa: Anatomy of a Killing
This thread combines fact-checking techniques with visualizations using Google Earth tools to geolocate and verify the location of a gruesome murder of women and children in Cameroon. The BBC then used the Twitter thread to explain the process of how they proved the Cameroon government was lying to cover up the military’s involvement.
Sarah Smith: Fact-Checking Ben Carson on Houston Housing
The Houston Chronicle’s housing reporter used data and fact-checking skills to correct U.S. Secretary of Housing and Urban Development Ben Carson in this Twitter thread.
Student Projects
In the early days of the COVID-19 pandemic, student reporters for The Red Line Project at the University of Illinois-Chicago built several visualizations from datasets both global and local. They kept data diaries as they downloaded, cleaned and analyzed the data. They logged background on how they visualized the data and how it fit contextually into the story.
They turned their diaries into Twitter threads, such as this one by then-senior Janette Romero. (Fig. 1)
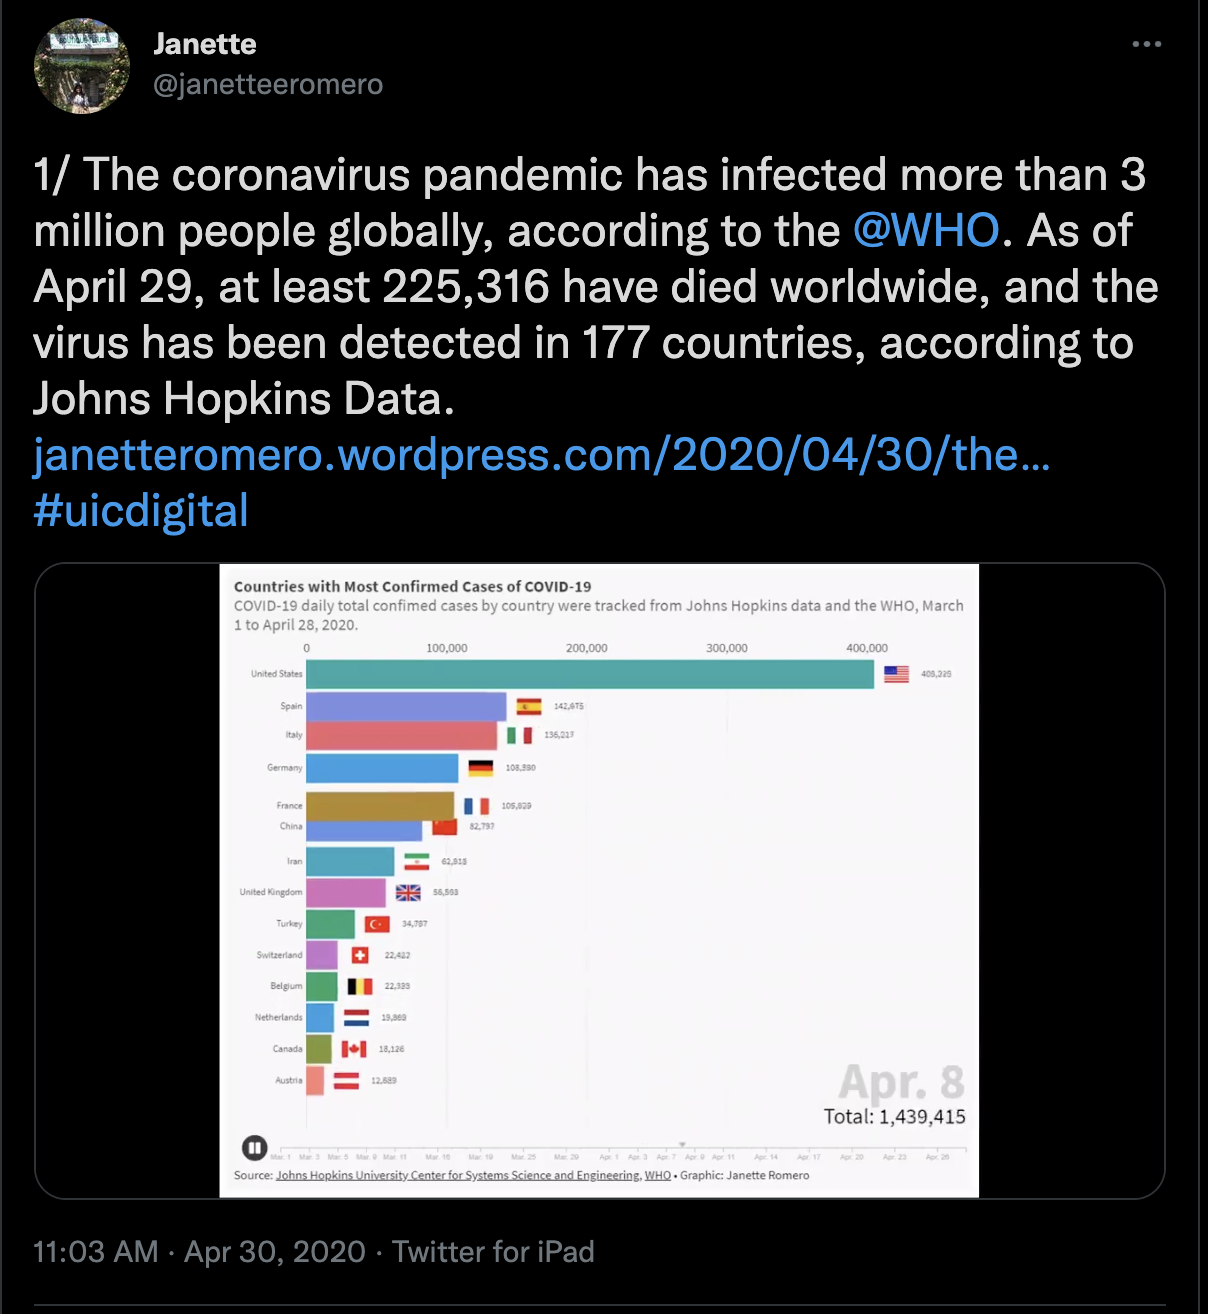
Fig. 1
Romero posted a thread of eight tweets, with the first one featuring a link to her story and an animation showing COVID-19 positive cases by country through the first three months of the pandemic. Her threaded posts featured other charts her team built, their reporting methods and where they found the data.
UIC senior Chris Katsaros and his team used a Twitter thread to explain reporting on Illinois COVID-19 cases. Senior Charles Tharpe used a Twitter thread to highlight key points in his team’s story on COVID-19 and the increase in domestic violence during the pandemic’s first few months.
Visualizations on Social Media
Journalists often use text cards – graphics that focus on single stat or quote – to feature on Twitter posts teasing a story. These text cards can be easily built with tools such as Canva (desktop and app), Adobe Post or Photoshop (desktop and app), Over (app) and other tools. They also can be built as animated GIFs with Google Data GIF Maker and other tools. These tools are handy for breaking stories – election night analysis, highlighting a stat or quote from a study, budget figures, crime statistics and more.
Some journalists pull graphics from their stories and attach them to tweets and provide a link to the story. The graphics grab readers’ attention as they scroll through Facebook or Twitter. Canva can be used to make text cards for Instagram stories. Apps such as Chartistic and Icongraph help journalists build charts on a phone or tablet that can easily be shared to social channels.

Leave a comment